Disclosure: I am short ALNY.
The past 12-14 months have seen a very strong rally in the overall markets, sending the Nasdaq index to levels not seen in 13 years. Biotech stocks have largely been leading the pack and have provided spectacular returns to those who have been chasing the ultra-high beta returns.
Since the beginning of 2012, the Nasdaq is up by an impressive 21%. Meanwhile, the Nasdaq Biotech Index (NBI) is up by a stunning 44% in the same period of time.
As in most stock market bubbles, we can see that the best returns typically come from the companies, which have the weakest fundamentals. The reason for this is simple. Companies with strong fundamentals are typically very easy to value such that quantifying their potential upside is quite straightforward.
But for money-losing companies with little or no revenues, the bet is typically being made on a series of transformational events in the future which it is hoped will provide outsized rewards if they are actualized. Certainly no one is likely to predict strong and steady companies such as Cubist Pharmaceuticals (CBST) or The Medicines Company (MDCO) to become ten baggers, or even a three baggers. But for many of the earlier stage, unproven biotech stocks, similar multi-bagger predictions are very common at present.
One sure sign of a bubble in biotech stocks is the fact that many stocks tend to show sustained rises even when there is no news. During such times, news that is even slightly positive will have a very dramatic and positive effect on the share price.
Some examples of recent biotech high fliers are as follows:
| Company | Ticker | % cng | Market cap | 2012 Revenue |
| Pharmacyclics | (PCYC) | 510% | $6.3 billion | $200 million |
| Arena Pharma | (ARNA) | 417% | $1.8 billion | $13 million |
| Infinity Pharma | (INFI) | 364% | $1.6 billion | $93 million |
| Alnylam Pharma | (ALNY) | 190% | $1.5 billion | $66 million |
| Sunesis Pharma | (SNSS) | 335% | $271 million | $5 million |
| Galena Biopharma | (GALE) | 310% | $130 million | Zero |
* Stock price change since Jan 1, 2012
However the surest sign of a bubble in biotech stocks is when stocks keep rising even when there is a steady stream of bad news, which intuitively should have caused the stocks to fall rather than rise.
As the bubble mentality sets in, both investors and sell side analysts consistently fail to properly incorporate new and negative information. Investors continue to buy the shares, pushing up the price. As they did in the Nasdaq bubble of 2000, sell side analysts simply re-adjust their target prices to higher and higher levels to keep up with the ever rising share price.
The best example of a stock, which continually rises despite a stream of ongoing negative news, is Alnylam Pharmaceuticals.
In addition, Alnylam shows that in a stock market bubble, it is the fundamentally weakest stocks that show the greater rises. A comparison between Alnylam and Isis Pharmaceuticals (ISIS) illustrates this point clearly. Both of these companies compete directly within the RNAi space, yet Isis has a far broader product portfolio which is in later stages of development.
| ISIS | ALNY | ||
| Phase III products or above | 4 | Zero | |
| Phase II products | 14 | 1 ongoing | |
| 2012 Revenue | $99 million | $67 million | |
| Market cap | $1.5 billion | $1.5 billion | |
| Price change | 102% | 190% |
* Stock price change since Jan 1, 2012
As can be seen, Alnylam has significantly outperformed Isis even though Alnylam has no Phase III products and only one Phase II product still active. In comparison to Isis, Alnylam has virtually no pipeline. Yet the two companies now have identical market caps and Alnylam’s price performance has been near double that of Isis since January 2012.
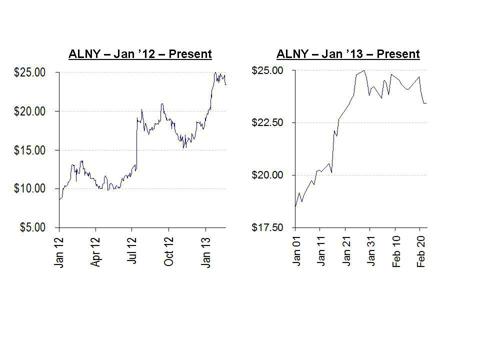
As shown below, shares of Alnylam have nearly tripled since the beginning of 2012, with much of the rise coming in just the past few months. In 2012 the shares traded as low as $8.33, while in 2013 the shares have risen nearly 30% from a low of $18.71.
During this time there has been a stream of negative news which has bounced off the company with virtually no effect. As the share price has continued to rise, sell-side analysts have continued to re-price the stock at higher and higher levels, giving little or no weight to new negative developments. While a small minority of analysts have in fact raised the alarm about the disconnect between the share price and the company’s underlying condition, these warnings have gone largely unheeded or unnoticed. These analyst have suggested target prices for the stock at below $15.00.
A significant uptick in insider and company selling indicates that those who are in a position to know the most are well aware that the valuation has run well ahead of the company’s clinical progress or commercial prospects. For example:
- Up until February 2012, insiders were consistent purchasers of the stock up until prices of $10.75. Since that time, insiders have been net sellers of sharesvalued at nearly $2 million in 6 months. The selling began as soon as the price started to exceed $17.00. Since February 2012, there has been only one insider purchase consisting of just 4,967 shares
- Alnylam’s largest shareholder, Novartis (NVS), began liquidating its holding, selling $30 million of stock. As part of the transaction, Novartis knew it would lose its subscription rights to purchase more shares directly from Alnylam. Alnylam had previously obtained this subscription right to offset dilution from options issuance. Forfeiting this right as part of the sale shows that Novartis is comfortable with permanently reducing or eliminating its stake and is no longer concerned about its holding being diluted. Novartis also registered its remaining holdings for sale, signaling its intent to sell its remaining 4 million shares.
- In January, when the stock hit $20.00, Alnylam itself also telegraphed that it recognized the shares were a “sell” rather than a “buy.” Alnylam issued $173 million worth of new shares in an opportunistic equity offering at $20.13 per share to raise $173 million. The offering represented a very large 17% of the company at the time, despite the fact that there was no new use of proceeds disclosed. The issuance of over $100 million in stock without a use of proceeds signals that the valuation at $20.13 was high enough to merit an outsized financing purely based on the elevated share price.
With the equity offering behind us, the next major catalyst which will signal a downward move in the stock will be continued insider sales along with larger sales which should be anticipated from Novartis.
The reason why insiders, large investors and management are eager to cash in on the current spike in Alnylam’s share price should be apparent. Even as the share price has tripled, Alnylam’s commercial and clinical prospects have without question encountered significant headwinds.
- In May 2012, Alnylam’s lead product ALN-RSV01 failed its Phase II trial. This product was the company’s most advanced product, and one of only two products by Alnylam to make it past Phase I.
- Shortly thereafter, Alnylam lost a lawsuit with Tekmira (TKMR) which had cited “relentless and egregious misappropriation of its trade secrets”. The two companies had worked together since 2004. Alnylam was forced to pay an immediate $65 million plus an additional $10 million in potential milestones to Tekmira.
- The spinoff IPO of Alnylam’s Regulus (RGLS) unit, a joint venture with IsisPharma, ended up pricing at $4.00, 60% below the indicated range of $10.00-$12.00. Alnylam owns 17% of Regulus.
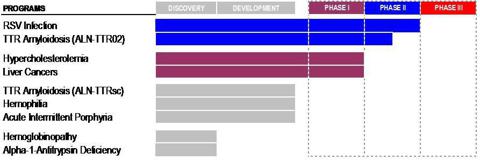
- As shown below, Alnylam’s “5×15 Product Strategy” predicting five products in late-stage development by 2015 is now looking more like a “1×16 Strategy” or perhaps a “2×17 Strategy” at best. Yet Alnylam has redefined the meaning of “5×15” and now continues to use this marketing phrase in a more “conceptual” way.
Under normal market conditions, each of the items above would certainly be regarded as a very large and material setback to a major part of Alnylam’s business. Yet in the current biotech bubble environment, none of the items above resulted in any meaningful drop in the share price or any revision by sell side analysts.
At the same time, a number of much smaller (but positive) announcements saw the share price jump immediately.
When Alnylam subsequently released new data on its hemophilia drug, the share price immediately soared by nearly 50%, reaching a then-high for the year of over $19.00.
This was the case even though the data were simply the results of pre-clinical trials only.
At roughly the same time, Alnylam announced positive results for its new lead product ALN-TTR02. Although the new lead product had simply proceeded though Phase I only, the stock was buoyed, offsetting the larger failure of its former lead product in the more significant Phase II trial.
Analysts have largely ignored the relative magnitude of the negative vs. positive developments. In each case, as the share price has risen, analysts have been quick to raise their price targets to an even higher price.
The justifications for the most recent round of price target hikes were based on a number of very small positives such as:
- A partnering with The Medicines Company to collaborate on a cholesterol drug. However, this drug is currently only in pre-clinical / Phase I trials.
- In February, Alnylam announced that:
– its Q4 net loss had quadrupled vs. the previous year
– revenues had fallen by 60% from the prior year
– for the full year, Alnylam lost over $106 million.
Despite the negative trends revealed in this data (and with no new clinical developments) analysts once again upgraded the stock causing the share price to jump by 7%. - In January, JP Morgan highlighted multiple new products to be pursued as part of the “5×15” strategy. Yet the JP Morgan report noted that these products would be either in pre-clinical or Phase I stages in 2014, effectively precluding them from meeting the Alnylam’s original criteria for “5×15”.
Alnylam’s “5×15 Strategy” has become a “1×16 Strategy”
Alnylam’s product strategy is a very complex and intricate one such that the science is well beyond the comprehension of many potential investors. As a result, in order to make things easier for investors to understand, Alnylam came up with a way to tell investors that “we will be making substantial progress on our pipeline, and we will be making it very soon”.
In January of 2011, Alnylam launched its “5×15 Product Strategy“, which stated that:
The company expects to progress five RNAi therapeutic programs into advanced clinical development by 2015, with the potential for early commercialization opportunities.
For any biotech company with a very early stage pipeline, this was a very bold public statement. Getting five therapeutic programs into advanced clinical development within four years should be considered a major challenge.
Two years have now passed. Alnylam’s lead product (ALN-RSV01) failed inPhase II clinical trials and just one other product has entered Phase II to take its place. The new product ALN-TTR02 is scheduled to complete Phase II clinical trials in mid-2013. If it meets its endpoints, it will then proceed to Phase III, with potential commercialization in 2016 subject to ultimate FDA approval.
The “5×15” slogan has been a very useful way to encapsulate for investors Alnylam’s very complicated product strategy. However with just two years left and only one product having successfully progressed beyond Phase I, it now appears that there is zero possibility of achieving anything close to the initially stated goals.
As a result, Alnylam’s “5×15 Strategy” is beginning to look more like a “1×16 Strategy”. Although with the subcutaneous variation of the product, this could also potentially become a “2×17 Strategy”.
In any event, at the time of the “5×15” launch, Alnylam had a market cap of $500 million. Following the recent equity offering, the company now boasts a $1.5 billion market cap even though its realized results in product development will be substantially less, and occur substantially later, than was initially projected.
Back in May, when ALN-RSV01 failed, Alnylam was a $500 million company with $180 million in cash. Alnylam’s entire pipeline was therefore worth just $320 million. Had the Phase II trial been successful, there would likely have been substantial upside in the stock. However, when the trial failed, downside was cushioned by the fact that Alnylam had several other shots in goal, including ALN-TTR02.
Now, in 2013, the risk / reward proposition has been flipped upside down. The valuation has currently spiked to $1.5 billion. Even if ALN-TTR02 passes Phase II this year, there will likely be limited further upside given that success has already been priced in.
But if the product fails Phase II, then the downside will need to be very substantial. Unlike in 2012, Alnylam is now lacking in a near term back-up plan at the same time that the valuation has spiked. So while the upside at Phase II is now limited, the downside is now quite substantial.
Absolute valuation vs. relative valuation
So far, the data points presented demonstrate quite clearly that there has been a significant disconnect in the relative valuation of Alnylam. In each case there has been some new development which was substantially detrimental to Alnylam, with the result that the company as a whole should have been worth something less relative to what it was worth prior to the realization of the news.
Given that the share price continued to triple through such news, it should come as no surprise that there is an even larger disconnect in the absolute valuation of Alnylam. In other words, what is Alnylam really worth in absolute terms vs. the $1.5 billion market cap of the company.
From the following graphic, it can be seen that the bulk of the value of Alnylam is attributable to one product only, ALN-TTR02. Alnylam’s RSV product failed at the end of Phase II and its status is now unclear. The remainder of its products are now either in Phase I, or are not even in clinical trials at all yet.
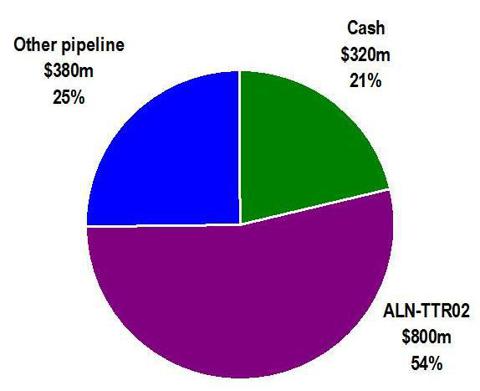
With the vast majority of the current value of Alnylam being attributable to ALN-TTR02, and with a current market cap of $1.5 billion, the breakdown of valuation components can be roughly described as follows:
The “other” category consists of products which are still in Phase I or which have not even begun clinical trials. Valuing these products at $380 million (25% of the value of the company) is likely more than generous in comparison to publicly listed biotech companies with similar early stage portfolios. It is also in line with (and slightly greater than) what the market valued these products at in May 2012, when its lead product failed in Phase II. Alnylam has disclosed that it expects to end 2013 with around $320 million in cash.
The point of this graphic is that the recent surge in market cap of Alnylam now needs to be overwhelmingly justified by the results of just one product, ALN-TTR02. If that product succeeds in Phase II trials, then there may not be much additional upside. However, if the product fails, then the share price could fall by as much as 54% to around $12.00.
The failure of ALN-RSV01 was entirely unexpected. However, the very low valuation of the company at the time cushioned the stock from any impact. Now however, there is virtually no upside to be had from success and tremendous downside to be had if Alnylam encounters a second unexpected failure inPhase II.
The value of a successful Phase II for ALN-TTR02
ALN-TTR02 and ALN-TTRsc are intended to be orphan drugs to treat ultra-rare indications (FAP and FAC) affecting just 50,000 individuals worldwide.
There are already multiple competing products being brought by competitors which are further along than Alnylam. Pfizer (PFE) has Vyndaqel which is inPhase III in the US and is already approved in Europe. Isis, along with partner Glaxo (GSK), has ISIS-TRRx which is proceeding with a Phase II/III study.
Despite the fact that it is farthest behind with a drug that may end up losing in a winner-take-all race for orphan status, the market is awarding a $800 million valuation to this single drug, which has yet to even complete Phase II.
By comparison, the entire value of Isis is only $1.5 billion, which includes its own similar (and more advanced drug) along with a pipeline of more than a dozen other advanced products.
Ultimate commercialization still needs to await a successful Phase II trial, then a successful Phase III trial, along with final FDA approval. If all of these things happen as desired, then Alnylam may begin to receive revenues from it in 2016, three years from now.
As a result, any valuation above $300 million would be considered overly optimistic based on its current status.
To further demonstrate this benchmark valuation, it should be noted that when Pfizer acquired competing drug Vyndaqel, it did so by acquiring all of FoldRX(the developer of Vyndaqel) and its entire drug portfolio for a total price of $400 million.
At the time, FoldRX’s most advanced drug was tafamidis meglumine, which was in late stages for approval for treating transthyretin amyloid polyneuropathy. Other products in earlier stages included drugs for Parkinson’s disease, Huntington’s disease and cystic fibrosis.
At the time, Vyndaqel was in Phase II, just like ALN-TTR02 is now.
Again, the purchase price for the entire portfolio was $400 million, which would result in a value for Vyndaqel of around $100-200 million.
As a result, with Alnylam the valuation risk here is considerable.
Even if ALN-TTR02 achieves successful Phase II results, the valuation of Alnylam could easily be expected to contract by as much as $500 million simply because the current valuation for Alnylam has far overshot its market potential of its only near-term drug as a result of the current biotech bubble.
Conclusion
Taking a larger picture view, it is important to keep in mind that Alnylam is engaged solely in the production of RNAi therapeutics. However, the FDA has never even approved a single RNAi therapeutic (drug), ever.
In addition, Alnylam has yet to advance a single product into a Phase III trial.
At present, the $1.5 billion valuation of Alnylam is overwhelmingly dependent upon the near-term clinical prospects of a single drug, ALN-TTR02. Yet the valuation has already spiked so dramatically amid the Biotech Bubble, that very little upside remains even if the trial is successful. In fact, given the current valuation of the company, a successful trial amid a flattening biotech market could still see the value of Alnylam’s stock correct by around 20-30% by itself.
If the trial fails, then the valuation of Alnylam will be determined according to the company’s other drug prospects which are all currently in Phase I or in pre-clinical development. As a cushion, Alnylam has disclosed that it expects to end 2013 with $320 million in cash, which equates to $5.24 per share in cash.
The result of a failure in Phase II would be a valuation for Alnylam of at most $700 million, implying the potential for a drop of more than 50%.
Over the past 14 months, investing in Alnylam (and many other biotech stocks) has been a very enjoyable one-way street. Bad news has simply not mattered.
Yet at some point in time, the valuation simply must reconnect with the fundamental prospects of the company.
Insider activity strongly points to the fact that insiders are well aware of the overshoot in the stock. The higher it goes, the more they sell.
Insiders were net buyers at prices of around $10.00 and below, yet they quickly became net sellers at prices of $17.00 and above.
Novartis was quick to forego its subscription rights in order to sell off $30 million in stock at elevated prices. Novartis had previously been the single largest shareholder in Alnylam. The registration of its remaining shares indicates that Novartis will continue to monetize its stake rather than hold until 2016 to see if revenues materialize.
Last, a few weeks ago Alnylam itself was quick to issue shares representing 17% of the company, despite no new use of proceeds. This speaks loudly to the fact that a price of $20.13 is one that should be locked in quickly and in large size, as confirmed by Alnylam management.
The current price of $23.44 is 20-30% above where insiders, Novartis and Alnylam itself has been selling shares in large volume. And in the near term there remain no natural catalysts for further upside movement in the stock, withPhase II results not being expected until mid-late 2013.
The one-way street appears to have hit a dead end for now, and it is likely time to head back in the opposite direction.
Additional disclosure: The author was previously an investment banker for a major global investment bank and was engaged in investment banking transactions with a wide range of health care companies including pharmaceutical, genomics and biotech companies. The author has not been engaged in any investment banking transactions with US listed companies during the past 5 years. The author is not a registered financial advisor and does not purport to provide investment advice regarding decisions to buy, sell or hold any security. The author currently holds a short position in the stock of ALNY and has provided fundamental and technical research to investors who hold a short position in the stock. The author may choose to transact in securities of one or more companies mentioned within this article within the next 72 hours. Before making any decision to buy, sell or hold any security mentioned in this article, investors should consult with their financial advisor. The author has relied upon publicly available information gathered from sources which are believed to be reliable and has included links to various sources of information within this article. However, while the author believes these sources to be reliable, the author provides no guarantee either expressly or implied.


