

Dillard’s (DDS) could quickly double on “upside perfect storm”
-
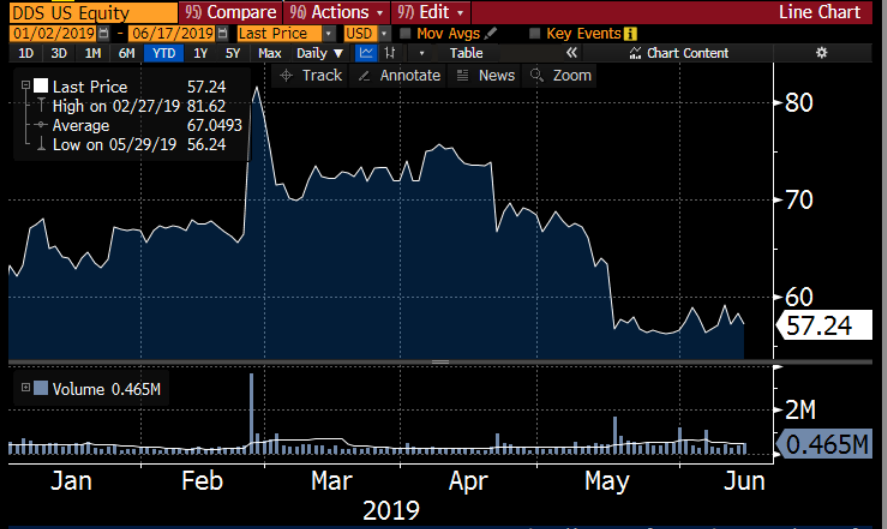
The “upside perfect storm”. Dillard’s is now hitting another upside “perfect storm” like the one that last saw it spike up to the $90’s. But this time I expect that the share price could double (or more). The share count is now much lower (higher intrinsic per share) and the float is now much tighter. In addition, David Einhorn already sold out at $75, such there is no longer the overhang of shares which had previously restrained the upward price spike.
-
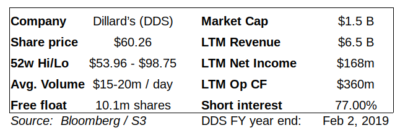
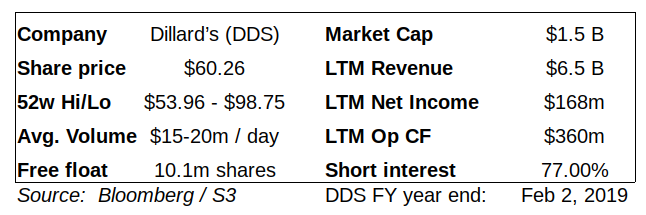
Short interest in Dillard’s just jumped to 77% as shown by S3 data on Bloomberg. But the usual bi-weekly short data from the NYSE doesn’t get released until tomorrow (Tuesday) after the close. So, until tomorrow, few people are yet aware of this 77% short interest.
-
Dillard’s has continued its hyper-aggressive share buyback, even at prices in the $80s. When the share price drops into the $50s and $60, Dillard’s has typically accelerated the buyback very sharply. Yet the disclosure of reductions in share count comes out only at infrequent intervals, often many weeks later, catching market participants by surprise and sending the share price soaring.
-
Despite lackluster earnings, Dillard’s generates tremendous cash flow to finance the buyback. Dillard’s is continuously profitable and has very stable revenues. More importantly, Dillard’s generates so much cash that it has been paying down its small amount of debt even as it aggressively buys back shares. Moody’s re-iterated Dillard’s as investment grade just last week. Dillard’s currently has the authorization and the cash flow to repurchase more than 6 million shares (with only 10 million shares remaining in the entire float)
-
Important. Here is why Dillard’s is aggressively buying back shares. Dillard’s real estate holdings are still recorded on its balance sheet based off of book value using decades old purchase prices. Yet in third party valuations, even the most ultra-conservative assumptions show a market value which is well in excess of $4 billion. Due to the shrinking share count, this now equates to over $180 per share (yes, even using the most ultra-conservative assumptions)
-
Important. Here is why investors are missing this. Dillard’s does not hold quarterly earnings calls, does not present at conferences and does not provide sales or earnings guidance. In the absence of any pesky optimism, Dillard’s gets to quietly continue its aggressive share buyback.
-
This report is the opinion of the author. The author is long Dillard’s (DDS). Click here for additional disclaimers and disclosures.
Intro. Why are we suddenly seeing so many “infinity squeezes”?
The recent 700% surge in Beyond Meat (BYND) is a strong reminder that the “infinity squeeze” phenomenon is now becoming common knowledge by corporates as well as by traders. This is why large price spikes are occurring far more frequently than in the past. The similarities across varied situations are obvious: short interest goes above 50% amid an already-low or still-shrinking free float which then triggers a violent upward price spike. Yes, these similarities are obvious. But there are also some significant differences which are important to understand. Especially when share buybacks are involved.
Share buybacks and insider trades were a major part of my past reports which predicted in advance the price spikes in shares of Revlon (REV), Restoration Hardware (RH) and Dillard’s (DDS), among others. Each of those long trades ended up working out quite well over the subsequent weeks and months. In looking at the material below, Dillard’s once again displays very obvious similarities to what we saw in the past ahead of the big spikes in Restoration Hardware and Revlon. Below are my past reports for reference.
-
Long RH. RH Will Spike Much, Much Higher Very, Very Soon (Moxreports, Nov 2017)
-
LONG DDS. Long Dillard’s on potential “infinity squeeze” (Moxreports, Jul 2017)
-
How you could have predicted the Tilray mega squeeze (Moxreports, Dec 2018)
-
Long REV. Missed disclosure changes point to Revlon buyout (Moxreports, Jun 2018)
Dillard’s long thesis. “It’s about real estate not about retail”
Here is why Dillard’s share price is low and the short interest is high. The label “Bricks and mortar retail” has become synonymous with “buggy whip” as a sector in terminal decline. The entire sector has been perceived as a “no brainer-short-to-zero”. The inevitable implosion of Sears (SHLDQ) and JC Penny (JCP) are very intuitive examples.
But Dillard’s is categorically different that those dying dinosaurs. And this difference is precisely what many have missed. Clearly anyone using a retail-friendly stock screener we will immediately come to the conclusion that Dillard’s looks moderately over-priced based on standard earnings multiples for retail stocks. But as shown below, quarterly fluctuations in Dillard’s retail business should now have almost nothing to do with the value of the shares.
Dillard’s is about “real estate not about retail”. Because Dillard’s owns its own stores, the company is sitting on more than 44 million square feet of owned real estate. This real estate is still recorded on Dillard’s balance sheet based off of book value, which is calculated based on purchase prices which are often decades old. Even using the most conservative estimates possible, third party valuations put the value of Dillard’s real estate holdings at more than $4 billion. In Appendix II, I include a series of valuation data points provided by a range of third parties. Even combining the most conservative assumptions shows a value which is more than double Dillard’s current market cap, even when we ignore completely the value of the retail business.
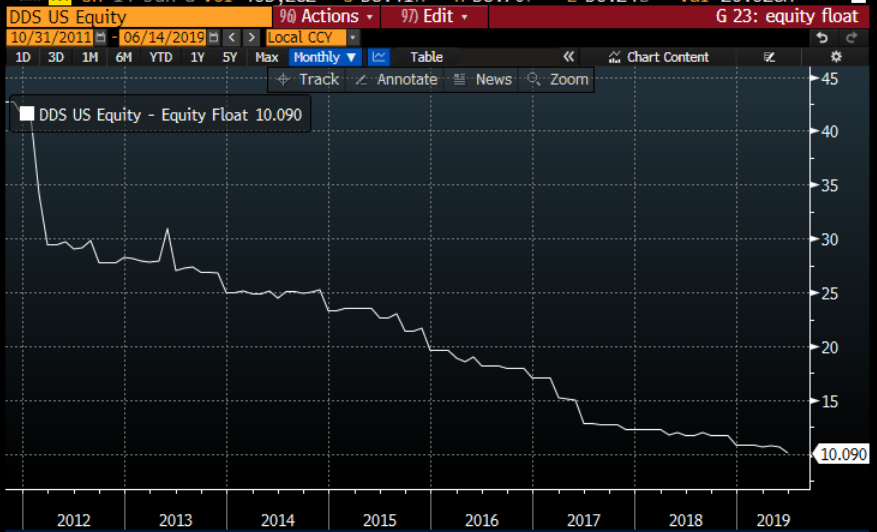
This $4 billion in real estate explains Dillard’s ultra-aggressive share buyback, which Dillard’s continues even at shares prices in the $80s. This simple math is why Dillard’s has aggressively used company cash flow to buy back more than 70% of its outstanding float over the past few years. With the float declining, the proportion of shares owned by insiders has already risen to more than 50% of shares outstanding. And this proportion continues to rise with each additional share repurchased by the company. Once the outside float is all gone, existing insiders will be left owning all of this real estate without even spending their own money. Insiders include Dillard’s family members and the Newport Trust which manages the Dillard’s employee investment plan. It’s a fantastic gig if you can get it. The table below shows the since 2012, the float has fallen from 43 million shares down to 10 million at present.
Dillard’s strong cash flow fully enables this very aggressive buyback, and with no financial strain. Under its latest authorization, Dillard’s still has remaining approval to repurchase up to $389 million of shares, equating to nearly 6.5 million shares at current prices. The table below shows just how aggressive Dillard’s has been with the buyback and why Dillard’s can easily continue and accelerate from here, with no financial strain to the company. (In addition, the strength of the balance sheet and the cash flow also explain why Moody’s re-iterated Dillard’s as investment grade just last week.)
As shown below:
-
Dillard’s consistently generates $300-500 million of operating cash flow per year
-
There are now only 10 million shares in the entire remaining float.
-
Dillard’s has very low outstanding debt which it has been largely paying down each year, even as the company simultaneously repurchases its own shares.
-
Not surprisingly, Moody’s reiterated its investment grade rating on Dillard’s just last week.
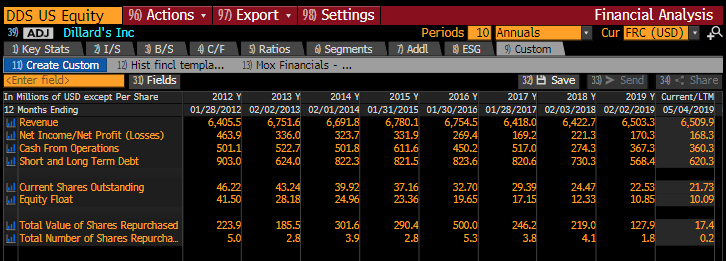
(Note: Dillard’s has a fiscal year end in February. So they just completed FY2019. The most recent quarter as of May 4, 2019 is reported as Q1 of FY2020. Debt fluctuates up or down from quarter to quarter, but has been decreasing every year. The share count shown by Bloomberg refers to Class A shares, which are the only ones that trade. Dillard’s also has 4 million Class B “super-voting” shares held by insiders. The Class B shares do not trade. )
The sharp boost from Dillard’s share buyback has two separate impacts: fundamental impact and trading impact. First, simply due to the dwindling share count, the value per share of Dillard’s real estate has increased by more than 40% just since the beginning of 2017. Second, the aggressive buyback has had the effect that short interest has become a much larger percentage of the quickly shrinking float, without many people noticing. With 77% of the float sold short, this will sharply amplify any upward moves in the share price.
Short interest data is publicly released by the NYSE every two weeks. But there are also expensive subscription services such as S3 Partners which provide daily data to their subscribers via Bloomberg. A lot can happen in two weeks. Those who rely only on bi-weekly NYSE data can occasionally get hit by big surprises.
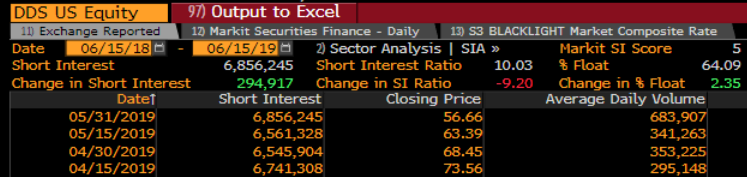
The most recent data from the NYSE was for May 31 and indicated that short interest on Dillard’s had already risen to 64%. The next release from the NYSE is due out tomorrow (Tuesday) after the market closes.
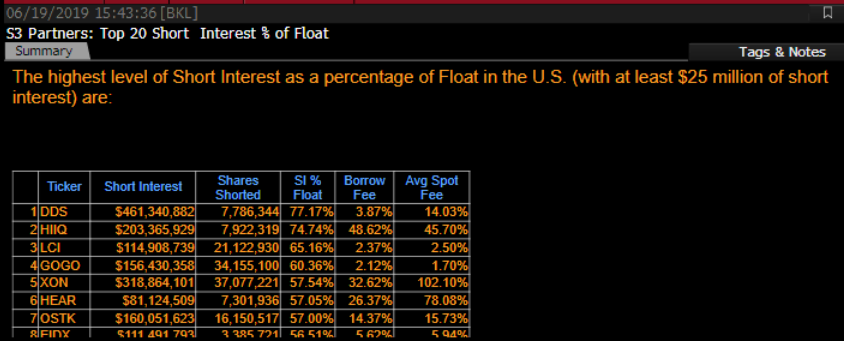
However, late week, S3 published that short interest had already risen to more than 77% of the float. As a result, many people who rely only on the NYSE bi-weekly data may be in for a big surprise.
The top table below shows the data from S3 which was published last week and which shows DDS as its most heavily shorted stock in the US at 77% of float. The table below that shows the most recent bi-weekly data from the NYSE.
Dillard’s buyback was ongoing, even in the $80s. But the buyback accelerates sharply when the share price drops to the $50s and $60s. Dillard’s May 2019 press release contains a line which very non-nonchalantly discloses: “Share repurchase of $17.4 million (0.2 million shares)”. This equates to a purchase price of over $87 per share, disclosed just seven weeks ago. Important: we have seen in the past that when the share price dips into the $50s and $60s that Dillard’s becomes far more aggressive with the share repurchases.
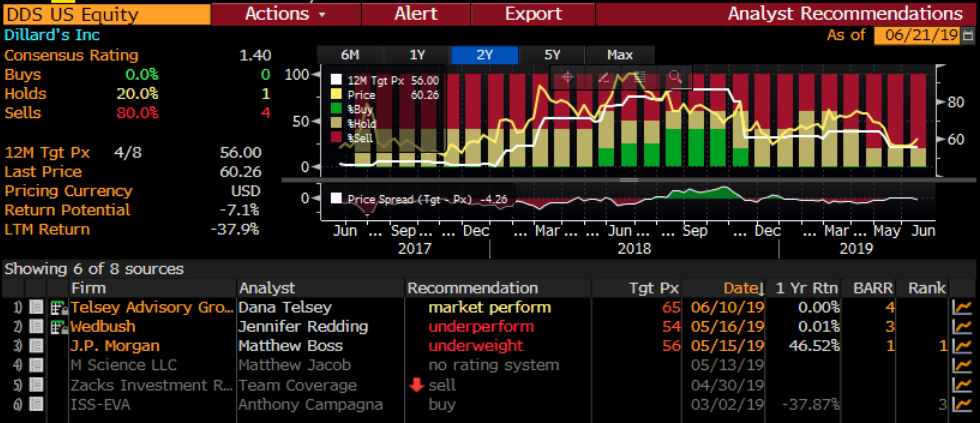
Why the market is missing the latest developments. Dillard’s is a low float stock in an out-of-favor sector. From both the trading standpoint and the investment banking standpoint there is simply no incentive for sell-side analysts to make a real effort with coverage. The sell side continues to provide coverage of Dillard’s as part of their overall sector coverage, but this coverage is almost entirely perfunctory. Commentary on Dillard’s itself is not substantial. Price targets and revisions are often arbitrarily set at level which corresponds to “about 10% below wherever the current price happens to be”. Take a look for yourself to evaluate analyst coverage over the past few years.
In addition, retail-oriented stock sreeners focus only on the income statement (revenue, earnings, margins, PE multiples, etc.). As a result, by ignoring the balance sheet and cash flow, they all come to an identical conclusion that Dillard’s “looks expensive relative to retail comps”. The cash flow, the buyback and the real estate are typically overlooked.
Dillard’s well-known policy of non-communication exacerbates pessimism further, allowing the aggressive buyback to continue at more attractive (ie. lower) share prices. A recent article in the Motley Fool is similar to what we see after most quarters:
“Dillard’s (NYSE:DDS) has taken shareholders on a roller-coaster ride in recent years, with huge volatility around its quarterly earnings reports. The regional department store chain doesn’t hold quarterly earnings calls, present at industry conferences, or provide sales and earnings guidance, so investors never quite know what to expect.” – (Motley Fool, May 19, 2019)
What has changed recently. In 2017, David Einhorn’s Greenlight Capital owned 2.5 million shares of Dillard’s which he exited completely at prices around $75 when Greenlight began facing redemptions. This extra supply of shares from Einhorn is what previously kept the share price capped below $100. However, since that time, Dillard’s has bought back more than 2.8 million shares (ie. more than 100% of what was sold by Einhorn). As a result, these shares are now gone, eliminating the overhang which could slow the price rise.
“The surprise factor”. History appears to be repeating itself. In 2017, here is what we saw: Dillard’s announced an extra-weak quarter which sent the share price plummeting, and which (not surprisingly) caused the short interest to rise. Once the share price dropped into the $50’s and $60’s, Dillard’s sharply accelerated its buyback. But reductions in the share count would not be disclosed until weeks later. Likewise, because the NYSE releases short selling data only bi-weekly, the aggregate rise in short interest also came as a big surprise. Shortly thereafter, we saw Dillard’s share price quickly spike into the $80s and $90s. In fact, with Dillard’s this sequence has played out on multiple occasions and has led to the same sharp price spikes.
Conclusion. The “upside perfect storm”. Just like the past spikes, Dillard’s is now hitting another “perfect storm”. Most investors are focused only on earnings, margins and PE multiples and have entirely missed the >$4 billion in real estate and the aggressive share buyback.
And now we also have the following:
-
The share count is now much lower, meaning much higher intrinsic per share.
-
The float is now much tighter, amplifying any upside price spikes.
-
The Einhorn overhang is gone, so there is little to slow a sharp rise in the stock price.
-
Dillard’s short interest just hit 77%, which should become clear when the NYSE publicly discloses the bi-weekly short interest data tomorrow
-
Dillard’s has likely been aggressively buying shares in the $50s, just like it has done in the past at these levels. A lower share count means and even higher intrinsic value and an even lower float, further amplifying the conclusions above.
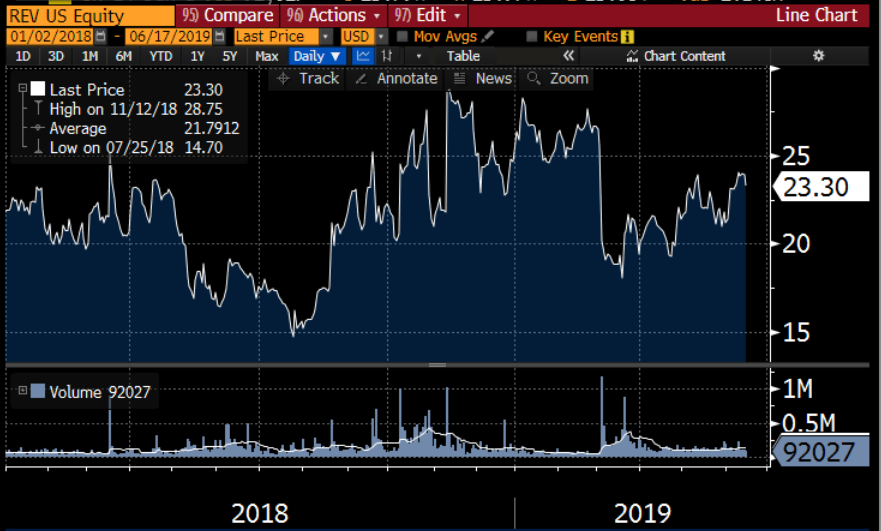
Appendix. Comparing Dillard’s to the “head fake” drops in Revlon shares. When companies or insiders are looking to buy lots of shares, we often see short-lived “head fake” drops in the share prices. Revlon and Dillard’s are great examples. In March, unexpectedly” “weak quarterly earnings sent Revlon below $16 in after hour’s trading. In the weeks after the plunge, majority shareholder Ron Perelman was a big buyer of Revlon shares during the weakness. Not surprisingly, Revlon steadily recovered to $24-25 within a few weeks. Following the steep plunge and Perelman’s buying, this was an easy 50% rebound. Based on past observations, I expect we will see a very similar sequence of events unfold at Dillard’s.
It is intuitive that the ongoing buyback by Dillard’s should have a far more pronounced effect on share price than Ron Perelman’s buying had on Revlon. With Dillard’s, it is the company itself (not an outside investor) that is buying back shares. So not only is Dillard’s buying soaking up the free float, but it is also increasing the intrinsic value per share of the underlying assets.
Appendix II – Estimating the value of Dillard’s real estate
There are two issues to consider below. First, Dillard’s real estate is not shown on the balance sheet at market value, such that its value is significantly under-recognized. Second, the ever-shrinking share count means that the value per share of this real estate continues to increase at an accelerating rate.
My view on Dillard’s is very deliberately imprecise. The valuation discrepancy is so large that my expectation that Dillard’s should “double” seems well within conservative reason.
Here are some data points:
Dillard’s real estate holdings have remained fairly constant over the past six years at around 44 million square feet. But the share count during this time, the share count has been cut in half (from 43.2 million shares down to 21.73 million shares, plus the 4 million non-trading “super voting” shares). On this basis alone, the value per share has increased sharply.
Different activist investors have come up with different methodologies during this time. The each ended up with valuations which are well in excess of $150 per share at the time. And don’t forget, since the time of these valuations, the share count has fallen even further.
Below are a series of reference links. Doing the math should be easy for anyone. There are 21.7 million shares outstanding and 44 million square feet of real estate. Plug in your value for price per square foot and you can determine your own estimate. Even the most conservative assumptions that I used leads me to more than $120 per share. And the estimates from third parties below extend well into the $200s.
My view is that an extended valuation analysis does not seem relevant because I expect that Dillard’s will repurchase the remainder of the float well before the stock price gets to $200 anyway. In all cases, the stock certainly seems quite cheap at $60.
https://assets.recenter.tamu.edu/Documents/MktResearch/US_Retail_Forecast_Marcus_Millichap.pdf
https://www.10xebitda.com/wp-content/uploads/2016/11/Marcato-Dillards-Presentation-Nov-2014.pdf